WhatsApp Status as a Marketing Channel: Exploring Viewership Trends vs. Internet Bandwidth Usage
The internet is experienced through Social Media use (Zimstat ICT Survey 2020). However, the activities occurring on these platforms are far more varied than the sharing of social posts. They range from news aggregation to e-commerce. While main social sites provide insights for business customers, such tools do not exist for personal accounts. Below is an attempt to map the best time to interact and garner attention based on the active hours of individuals. The results were surprising, to say the least.
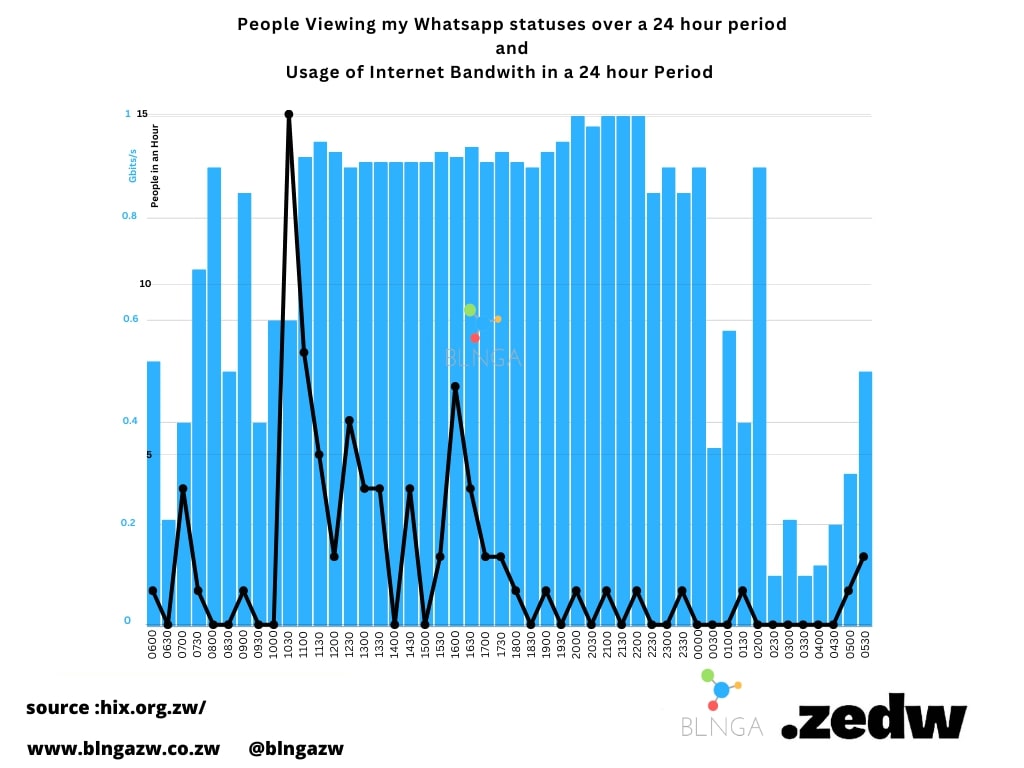
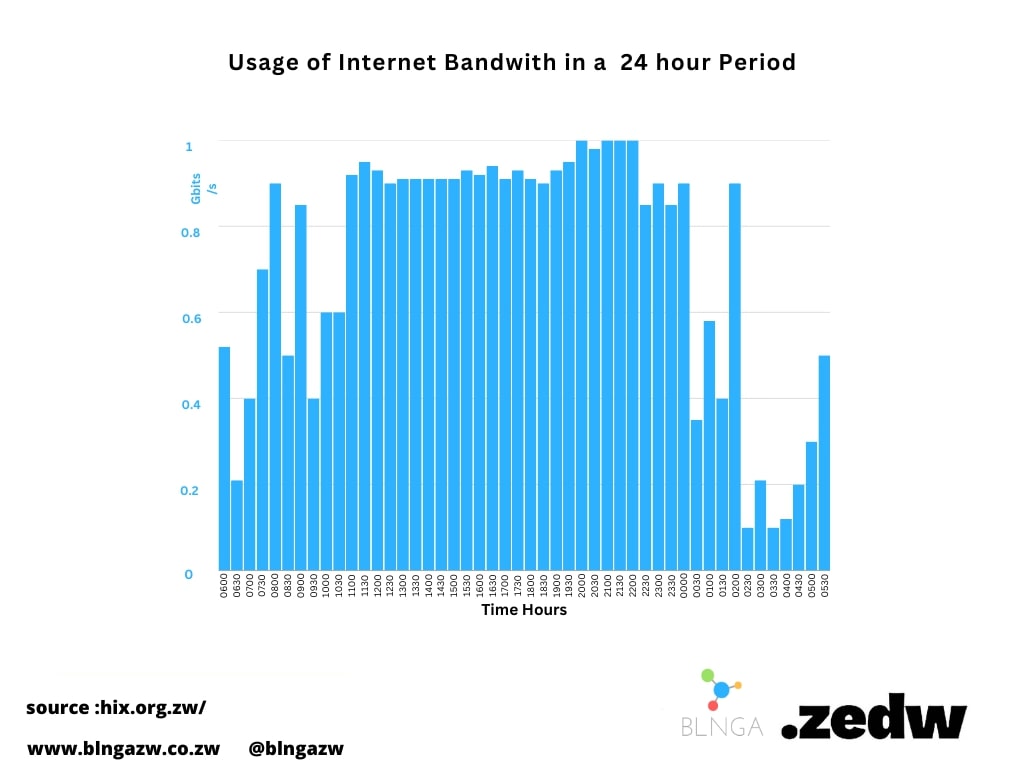
To create a baseline, I used the bandwidth demand data from HIX, which serves as a proxy for publicly available hourly usage of the internet in Zimbabwe. Their usage graph highlights a few things:
The internet is experienced through Social Media use (Zimstat ICT Survey 2020).
There is a spike at 0600–0630 as individuals check their phones before preparing for their day.
A sizable spike is again registered between 0730 and 0800, indicating usage while commuting.
Demand stabilizes at 1030, continuing up to midnight.
0200 has the lowest demand.
Over the last year, I have shared visualizations on my personal WhatsApp status. I recorded the activity, and in the image below:
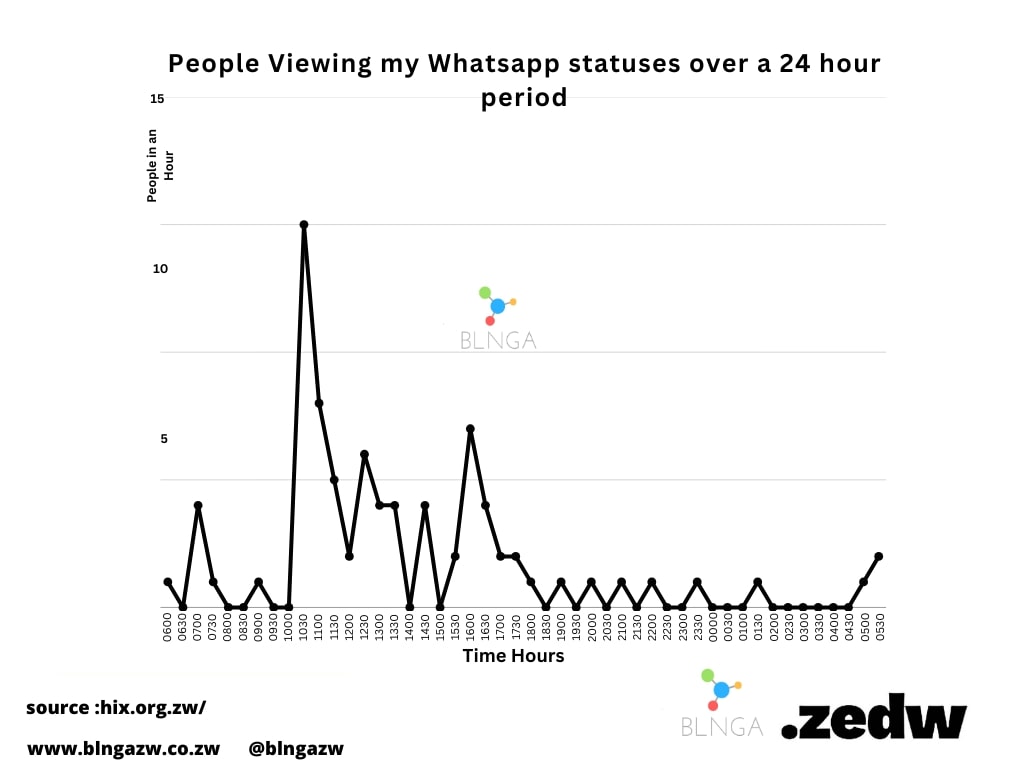
A few key observations:
The 0700 spike corresponds to the commute time observed in bandwidth demand.
1000 to 1130 is peak status viewership, also in line with the peak bandwidth kick-off period.
The second-highest peak is at 1600 to 1700, possibly indicating Focus fatigue and individuals checking phones before winding the day down.
Combining the two graphs yields an interesting insight: before people settle down to work, they quickly check their phone statuses. The data indicates that this is the best time to grab their attention. Posting on or around this time takes you to the top of their unviewed status.
Are you using WhatsApp statuses as a marketing tool? Let’s have a chat on how we can measure your interactions and derive insights.